![]()
![]()
![]()
Next: 3.0 Hardware/Software Co-Desgin Tools Up: Appnotes Index Previous: 1.0 Introduction
The System design process encompasses the following steps:
The RASSP Baseline 2 Systems design toolset includes:
The RASSP Baseline 2 Systems engineering tools are depicted in Figure 2.2-1.
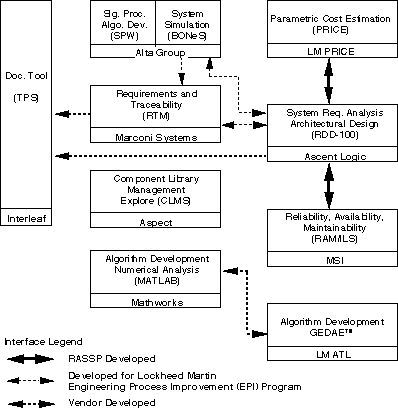
Figure 2.2-1. RASSP Baseline 2 system design tools.
Requirements and Traceability Management (RTM) provides the tools necessary to manipulate original customer system requirements specifications into a clear and unambiguous set of requirements to control design, implementation and testing. See Figure 2.2-2. Whenever a requirement is altered, a record is kept so that it is always possible to trace the evolution of a requirement back to its source. At this point in the requirement engineering process it is possible to rebuild the source (customer) document exchanging the original requirements with their successors. Ultimately this allows an updated requirements document to be published to the customer in a format compatible with his original source document, thus facilitating review and authorization of requirement statements towards an approved requirement baseline.
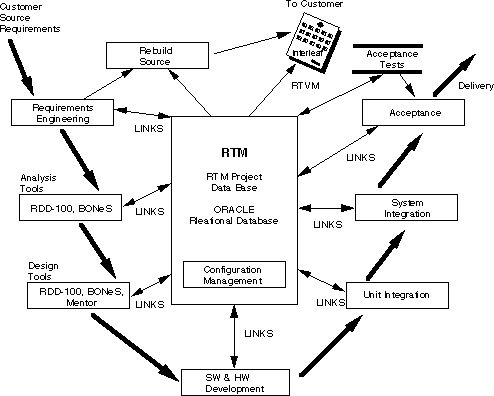
Figure 2.2-2. RTM lifecycle support.
RTM allows requirements to use indexed by keywords (e.g., performance, weight, power consumption, etc.) thereby allowing the user to obtain lists of related requirements. When requirements are extracted from a customer source document (multiple source documents are allowed), the RTM system associates various pieces of information with it. Some of this information is supplied by the system, some by the user. On extraction, the system always associates a unique number (called the key) with a requirement together with the date of extraction, the name of the source document and the name of the user performing the extraction. The system also associates a life cycle status with the requirement. This reflects how a requirement has been altered, if at all. A date and user name are stored for the most recent alteration to a requirement. As mentioned previously, links are maintained between requirements and their successors. These are all updated automatically by the system. The user is able to state attributes for the requirements. An attribute describes a characteristic of a requirement, e.g., its type, its level of acceptance, etc. Additional features of RTM are given below.
RDD-100 is a front-end tool that supports the requirements and functional analysis steps of the RASSP EPI Baseline Systems Engineering process. It enables the systems engineer to take RTM-captured requirements for top-level system design, analyze and model behavior that satisfies those requirements, design components that implement that behavior, examine architecture tradeoffs, and handle exceptions. See Figure 2.2-3.
Throughout this process, RDD-100 performs hundreds of static consistency checks to verify the completeness and traceability of the system under design. The Dynamic Verification Facility (DVF) is used observe the dynamic behavior of the system for potential timing or resource utilization problems.
RDD-100 uses predefined templates to create a variety of customer documents (for example, DOD-STD-2167A System/Segment Specifications, Interface Requirements Specifications, and several versions of the Software Requirements Specification). This customer documentation is extracted directly from the data generated during the verification of the design and system model analysis. Project documentation is therefore a byproduct of the systems engineering process, and it is always congruent with the system model.
RDD-100 contains a collection of utilities for creating, accessing, manipulating, extending, viewing, analyzing, and interfacing to/from elements in the System Descriptor Database (SDD). The system design is described in an Entity/Relationship/Attribute (ERA) Model. With this notation, a user specifies instances of elements (e.g., System Requirements) and describes their specific attributes and relationships to other elements (e.g., functions that fulfill those requirements).
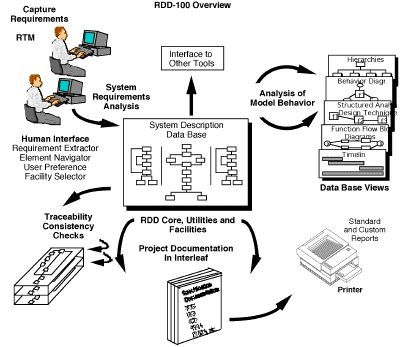
Figure 2.2-3. RDD-100 supports requirements and functional analysis.
There are four items that define an RDD-100 Facility (collection of similar elements):
The information in the SDD can be viewed in either Behavior Diagram (BD) form or other kinds of function graphs which include: IDEF0 Diagrams, N-Squared Charts, Function Flow Block Diagrams (FFBD), or Data Flow Diagrams (DFD). Behavior diagrams display the most information and you must create a Behavior Diagram before the information can be displayed in any other function graph type.
Another system view is provided by the Hierarchy Chart. These charts start with a top level element and trace through one or more relationships down a hierarchy to any number of levels.
This output can be an Interleaf "book", a postscript file, arbitrary ASCII output, Encapsulated PostScript files, or Context Document compatible. The user can generate report specifications from scratch, or modify the supplied templates.
A Behavior Diagram is a graphic view which represents both input/output data flow and a time order sequence of events. Behavior Diagrams can be decomposed hierarchically, show order of functional activation (precedence/relationship), define control data flow, and exit (completion) conditions. Related text shows performance traceability and other data (such as text descriptions). The sequence of behavior flow is generally top down and left to right. Behavior diagrams are comprised of Functions and Items. Functions and Items can be either Time or Discrete. A Function is a part of the system that carries out an action (i.e., convert an input to an output). An Item is something that a function accepts (input) or produces (output).
Behavior Diagrams have many constructs that control time flow. Refer to Figure 2.2-4. They include; Sequence, Concurrence, Select, Iterate and Replicate. A sequence is the simplest and most common structure. It consists of a single, vertical time-flow line with a series of functions in order from top to bottom.
A concurrence or parallel represents multiple paths of a process that can occur at the same time based on certain conditions, inputs, etc. Functions below the concurrence cannot start until all branches of the concurrence have completed. For example if there are two branches in a concurrence and one branch takes 5 minutes to complete and the other branch takes 5 hours and if both were started at the same time, functions after the concurrence could not be executed until the 5 hour branch is complete.
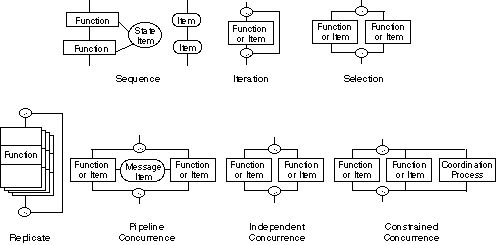
Figure 2.2-4. Behavior diagram structures.
The Block Oriented Network Simulator (BONeS) provides a Motif graphical environment for capturing the design of communication networks and simulating the performance of the captured design. The network design is created graphically by hierarchical, data flow block diagram generation.
The Data Structure Editor (DSE) is used to create data structures which are defined hierarchically and have an arbitrary number of fields. Fields can contain simple entities such as packet lengths and time stamps, or other data structures.
The Block Diagram Editor (BDE) is used to create network models. Primitives and other blocks are placed and connected to perform functions.
When the network model is completed, error and consistency checking is done. An event driven simulation of the network is executed using the Simulation Manager with user specified values for model parameters. An interactive simulation can be run to watch the flow of data on the diagram. Simulation continues until there are no more data structures in the block diagram or until the simulation clock reaches a user specified stop time.
During simulation BONeS collects data in the network using a variety of probes at user specified locations. The data collected during simulation is analyzed and displayed graphically using the Post Processor (PP). A variety of statistical analysis routines are available.
The Signal Processing Worksystem (SPW) provides tools needed to interactively capture, simulate, and test a wide range of digital signal processing (DSP) designs. SPW is used to evaluate various architectural approaches to a design and to develop, simulate and fine tune DSP algorithms.
The Block Diagram Editor (BDE) is used to create network models. Primitives and other blocks are placed and connected to perform functions.
The Signal Display Editor (SDE) is used to create, display, edit, process and analyze signal waveforms.
The Simulation Program Builder converts the signal flow block diagram from the BDE database into an executable program that simulates the behavior of the signal processing system. It takes the simulation inputs from the SDE database and places the simulations outputs into the SDE database
MATLAB is a high-performance, interactive numeric computation and visualization environment. It combines the advantages of hundreds of prepackaged advanced math and graphics functions, with the flexibility and extensibility of a high-level language to customize and add new functions as needed. MATLAB combines numeric analysis, matrix computation, sparse matrix computation, signal processing, 2-D and 3-D graphics, and other functions with a user interface where problems and solutions are expressed mathematically without the need for traditional programming.
MATLAB application toolboxes extend the functionality of MATLAB by providing algorithms and functions developed by renowned experts in digital signal processing, control system design, neural networks, system identification, dynamic simulation, optimization, and other application areas.
The MATLAB Signal Processing Toolbox works with MATLAB numeric computation software for 1-D and 2-D digital signal processing and time-series analysis. The Toolbox includes 1-D and 2-D FFTs and inverses, FIR and IIR filter design, filter response and simulation, and power spectrum estimation.
MSI is incorporating the RAM-ILS toolset for design assurance management into the overall RASSP system design environment. These tools measure an important quality-related aspect of the design in progress. The MSI RAM-ILS toolset consists of synergistic tools working within the design framework. The RAM-ILS toolset uses the design toolset to assess functional robustness, functional reliability, functional diagnosability, manufacturing process reliability (six-sigma quality methods), and deployment reliability-related issues. The RAM-ILS tools consist of the features shown in Table 2.2-1.
Revisions to correct reliability and quality issues are a costly and time-consuming process. The MSI Design Assurance toolset will identify issues as the design progresses. The RASSP RAM-ILS tools will provide auditable 'second opinions' for the reliability, safety, producibility, life-cycle costs, and related quality viewpoints.
The RASSP Design Assurance Manager toolset provides feedback to designers from concept through completion. The MSI RAM allocation tool uses the mission requirements in a deployment simulator to allocate functional safety, reliability, diagnosability, maintainability, supportability, life-cycle costs, and quality requirements. The allocations are used as the benchmark for comparisons all phases of the design. The allocations will be used in trade-off studies to determine return on investment in terms of economic and performance issues. The MSI Primary Predicted Costs of Ownership model provides a consistent basis for trade-off studies.
The classic methods of reliability prediction Mil-HDBK-217 are based in device statistics. Much of the RASSP design process will use new, advanced technology with little statistical history. MSI's RAM-ILS toolset is based on reliability physics. Parametric variation caused by heat, oxidation, humidity, and other factors of aging are integral to the RASSP RAM-ILS methods. Worst case analysis methods evaluate the robustness of a design to withstand the effects of
radiation, aging, electrical, mechanical, and thermal conditions. Digital and analog design tools are integral to the RAM-ILS evaluation.
GEDAE™ is a highly interactive graphical programming and autocoding environment which facilitates application development, debugging, and optimization on workstations or embedded systems. Its graphical editor supports building data flow graphs which are very readable. Explicit inputs and outputs are identified and user notes can be inserted directly on the graph canvas. The same user interface which supports the graphical editor is used for controlling all activity within GEDAE™. Capability is provided for the designer to readily partition graphs and map the partitions to multiple workstations or multiple processors in an embedded system. Autocoding generates appropriate schedules and code for each processing element which is efficient in terms of execution time and memory usage.
A GEDAE™ Run-Time Kernel provides all of the interprocessor communication required by the particular software mapping. Although the designer has flexibility in selecting the type of communication used (e.g., socket, DMA, or shared memory), implementation of the communication is automatic. Therefore, the application developer never needs to write any interprocessor communication software.
Algorithms are captured in GEDAE™ by placing processing functions extracted from a library on a canvas and interconnecting them using the extensive facilities of the graphical editor. Using a top down design approach, the basic building blocks and data passing requirements can be put on the canvas. In this way, the application designer can build, test, and analyze algorithms with point and click simplicity. Designers can select from functions contained in the extensible library. Library functions are provided for most of the commonly used signal processing functions. Understanding that a function library will never be complete, templates are provided for creating new functions. In addition to providing all of the typical data types, GEDAE™ has the important capability to define new arbitrary data types (e.g., complex C structures) for use with custom primitives. This ability is of great importance to users who want to capture heritage software which is generated in modules whose I/O is maintained as complex data structures.
Hierarchy is supported in a flow graph which simplifies complex application understanding. GEDAE™ supports extensive and efficient parallel processing.
Execution of GEDAE™ graphs is controlled through the same interface used to construct the graph. Users can modify parameters in the graph on the fly and observe the impact of those changes. The ease of making modifications to a graph and its operating parameters increases productivity by making it easy for designers to fine tune applications quickly. Execution results are presented to the designer in the form of detailed timelines and execution schedules along with memory maps to support the designers analysis of system solutions.
GEDAE™ provides an efficient autocoding capability driven by partitioning and mapping defined by the user. Because GEDAE™ handles all interprocessor communication, the designer never has to write any communication software. GEDAE™ launches the compilation, linking, loading, and execution of the application on the embedded hardware. An embedded run-time kernel on each processor supports execution. GEDAE™ generates the execution schedule for each processor and provides the user the ability to divide schedules into subschedules which may all operate at different firing granularity to optimize performance. Execution schedules and memory maps are presented for analysis.
A new architecture is defined as a specific vendor's COTS product in conjunction with the operating system (or board support software) and optimized function library used by the vendor.
There are three steps required to port GEDAE™ to new architectures. First, the communication software is modified to use the specific operating system and/or board support package provided by the vendor. Second, all communication mechanisms that are supported by the specific hardware must also be supported by the autocoding for that hardware. For example, some SHARC hardware utilizes only SHARC links for all communication while other hardware also provides switching networks or local buses. In addition, various communication protocols are used including, shared memory, message passing, and DMA. Third, a version of the GEDAE™ primitive library which utilizes the optimized math library supplied by the vendor must be provided.
GEDAE™ is relatively easy to port to new architectures (even those not using an operating system) because the communication layer has been optimized and reduced to approximately 600 lines of code. ATL has ported GEDAE™ to various hardware including three different vendor's hardware architectures with different communication mechanisms, both on a board and between boards. The currently supported architectures utilize SHARC, Power PC, and i860 processors.
GEDAE™ supports the optimization of partitioning and mapping, memory usage, communication mechanism selection, schedule firing granularity, queue capacities, and scheduling parameters. GEDAE™ provides the ability to interactively manipulate these items which greatly improves the designers ability to optimize processing after retargeting an application to a new architecture.
Under the RASSP program, the synthetic aperture radar (SAR) application was implemented using the GEDAE™ tool. The application software that was hand-generated for a Mercury RaceWay architecture was re-implemented using the GEDAE™ tool on a similar Mercury architecture. The resulting autocoded application achieved the same execution and memory efficiency as the hand coded version-with approximately a 10X reduction in implementation time. The same application has been remapped to three other architectures by simply repartitioning, remapping, and reoptimizing the application on the new architecture using the optimization support within the GEDAE™ tool. The time utilized for retargeting was 2-3 days for each subsequent architecture.
The PRICE suite of Computer-Aided Parametric Estimating (CAPE) tools are used to estimate the development, production, maintenance cost, and schedules of Hardware, Software, and Micro-circuits. Parametric cost modeling is based on cost estimating relationships (CERs) that make use of product characteristics (such as hardware weight and software language) to estimate costs and schedules. The family of PRICE parametric tools include four models which are described below.
Hardware cost model (PRICE H) - The hardware cost model is used to estimate the cost and schedule for electronic, electro-mechanical, and structural assemblies. This model incorporates input data concerning yield, performance, quantity, process and design sensitivity, and complexity parameters. The hardware model provides cost and schedule output for the development and production phases of a program.
Hardware life-cycle cost model (PRICE HL) - The hardware life-cycle cost model is used to estimate the cost of operating and maintaining hardware systems throughout their deployment. Inputs to the life-cycle model include deployment parameters, maintenance concepts, cost, and escalation factors. The life-cycle model is a supplement to and operates in conjunction with the hardware model.
Microcircuit/module cost model (PRICE M) - The microcircuit cost model is used to estimate the cost and schedule for custom microcircuit, printed circuit boards, and electronic modules. The model uses functional relationships based upon parameters such as the number of transistors, percentage of new circuit cells, number of pins, board type and size.
Software/software life-cycle cost model (PRICE S) - The software cost model is used to estimate the cost and schedule for the design, development, integration, testing, and support of software. This model uses functional relationships based upon parameters such as function, lines of code, complexity, platform, application, and design reuse to estimate costs.
The PRICE cost models will be integrated with the RASSP system engineering, life-cycle support, and architecture selection tools. These integrations will allow engineers the capability to perform cost/performance trade-offs throughout the design process.
The Component and Library Management System (Explore (CLMS)) is an object-oriented extension to the existing commercially-available Component Information System (CIS) product. This extension supports the implementation of the RASSP Reuse Data Manager (RRDM) subsystem and consists of the following:
The data manager is an existing capability which will be extended to manage default objects, template objects, and temporary objects. A default object is a model for the design objects in a given class. The attributes (properties and values) for a default object may be used as a basis for creating a new object. Template objects enforce rules about required fields and values. Template objects may be mapped to individual design objects. Temporary objects are added to the database, but marked to be deleted or moved at a later time. Temporary design objects are useful for creating test cases for converting existing data.
The object viewer will allow users to search for reusable design objects using a powerful parametric search. It will use two windows; one for entering parametric search data and another for displaying results. The results of performing a search will be a list of all reusable design objects that match the specified parameters. The user can then pick individual reusable design objects on the list and view all of the parameters and cross-references associated with each reusable design object.
The object editor will allow users to enter design objects into the RRDM, or to update existing design objects. Updates typically involve adding, deleting, or editing object parameters and test items associated with a given object, changing permissions for a given object, and copying an object to a different class. The object editor will also allow users to add mappings between objects.
The meta-model editor will allow the database administrator or librarian to modify the hierarchical class structure by adding and deleting classes. The meta-model editor will be available either in interactive or batch modes.
Interleaf TPS is the common tool for document production used to create and manage technical documentation, work instructions, specifications, proposals, reports, data sheets, catalogs, forms, and correspondence.
TPS offers complete word processing, advanced graphics, automatic layout, conditional document assembly, multi-page tables to support traceability data and technical equations, data-driven charts, image editing, interactive equations, and centralized control over document content and format.
Additional Interleaf features are:
To support the RASSP System Definition Process, Ascent Logic's RDD-100, Lockheed Martin's PRICE cost estimating tools and Management Sciences' RAM-ILS toolset have been integrated together to provide a concurrent engineering design environment over multiple domains. This interface is shown in Figure 2.3-1. RDD-100 is used to capture and analyze the requirements, to define the functional behavior of the signal processor, to allocate the requirements and functions to each signal processing subsystem and to provide requirements traceability. PRICE cost estimating tools are used to estimate the development, production and support costs for the signal processor. The RAM-ILS tool is used to perform reliability and maintainability analyses.
The types of data which are passed from one tool to another consist of the data that typically resides in that tool which can be used by the other tool. For example, system engineering data is passed from RDD-100 to the PRICE cost estimating tool. A GUI interface for the PRICE tool in RDD-100 was not developed. The types of parameters which are passed from RDD-100 to PRICE include the equipment configuration, size, weight, power, technology and complexity factors. The development, production and support costs are passed back to RDD-100 from the PRICE tool. On the other side of the interface, the equipment configuration and allocated reliability and maintainability budgets are passed from RDD-100 to the RAM-ILS toolset. The reliability
and maintainability assessments are passed back to RDD-100 from the RAM-ILS tool. In addition, optimizations can be performed within the RAM-ILS toolset when the budget is not met and the tool can make recommendation on how redundancy can be added in the system in the most cost effective way to meet the requirements.
In addition, the RAM-ILS toolset is tightly integrated within Mentor Graphic's FALCON Framework. With this integration the RAM-ILS tools have access to detail design information such as thermal and stress profiles as the design progresses. This detailed design information can be used in more accurate reliability and maintainability analyses.
Figure 2.3-1. RDD-100/PRICE/RAM-ILS integration.
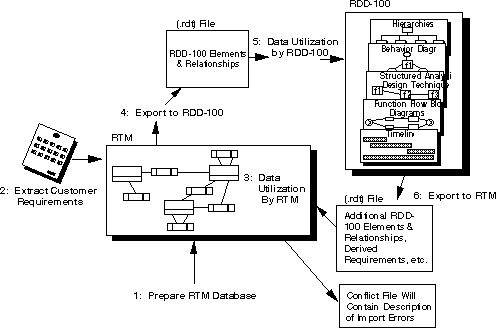
RTM/RDM integration supports the following process steps. An overview of the RTM/RDD-100 tool integration is diagrammed in Figure 2.3-2.
Figure 2.3-2. Overview of RTM/RDD-100 integration.
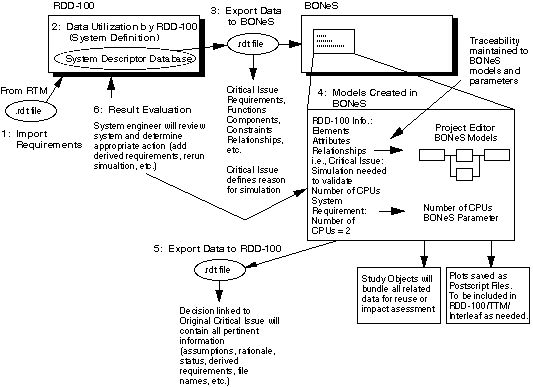
RDD-100/BONeS integration supports the following process steps:
Figure 2.3-3 depicts the integration of RDD-100 and BONeS.
Figure 2.3-3. Overview of RDD-100 BONeS integration.
RASSP CDRL A007 - 6/98 2-23
cad system description Baseline 2.0
Next: 3.0 Hardware/Software Co-Design Tools
Up: Appnotes Index
Previous:1.0 Introduction
Design Assurance Tools
Value Added Functional Reliability Risk Allocation
Reliability goals for hardware and software Circuit-Based Design Reliability Simulation
Calculate stress derating for component selection Functional Reliability and Longevity Analysis
Improved performance in the operating life cycle Deployment Life Cycle Cost Tradeoffs
Economic and Warranty Analysis Failure Modes and Effects Criticality Analysis
afety and Degraded Performance Analysis Diagnosability and Repairability
Maintenance Requirements Analysis Mission and Deployment Reliability
Durability, Capability and Performance Analysis Maintainability and Supportability
Support Staff/Equipment Requirements Analysis Worst Case Analysis (Aging and Degradation)
Parametric degradation analysis Thermal Damage Analysis (Aging and Degradation)
Thermal derating analysis 2.2.6 Lockheed Martin ATL
2.2.6.1 GEDAE™
2.2.6.2 PRICE S/M/H/HL
2.2.7.1 Explore (CLMS)
2.2.8 Interleaf
2.2.8.1 Technical Publishing Software (TPS)
2.3 System Design Tool Integration
2.3.1 RDD-100/PRICE/RAM-ILS Integration (RASSP Developed)
2.3.2 RTM/RDD-100 (Developed on LM EPI Program)
2.3.3 RDD-100/BONeS (Developed on LM EPI Program)
![]()
![]()
![]()