![]()
![]()
![]()
Next: 6.0 Enterprise System Tools Up: Appnotes Index Previous:4.0 Hardware Design Tools
A DFT tool database was developed in MS Excel. Based upon the database, Table 5-1 was generated which illustrates the gaps in currently available DFT tools in up-front test requirements and strategy management across all packaging levels (chip to system) and the holes in system and board BIT development and synthesis. Based on this gap, new tools will be developed for insertion into Baseline 2 and the final deliverable RASSP Design Environment.
Table 5-1. DFT Tool Gap.
| Tool Function | System | Board/MCM | IC |
| Test Requirements and Metrics Management | RDD-100 with RASSP Template, Consolidated Requirements Template | RDD-100 with RASSP Template | RDD-100 with RASSP Template |
| Test Strategy Management | EXCEL TSD Development and TA* Definition Investigation | TSD Development - Test Means Allocation Driven by TSD | TBD Development |
| Test Economics Modeling | TSD Attribute Population for Predictions Under Investigation | Test Economic Services | Test Economic Services |
| Testability Analysis | STAT, WSTA, STARS | MGC VTM:TOP | MGC QuickGrade |
| BIST Insertion and Synthesis | LogicVision BIST CAD Tools | LogicVision BIST CAD Tools MGC PTM:SITE | (Synthesis) Logic Vision BIST CAD Tools, (Insertion) Synopsys Test Compiler, (Insertion) Mentor FASTSCAN |
| DFT/ATPG | N/A | Teradyne VICTORY, ASSET Diagnostic Systems | Synopsys Test Compiler, Mentor FASTSCAN |
| Fault Simulation | Tool Gap | IKOS Voyager/FS | Multiple tools available for SSF**, Delay Fault Models under development for COTS |
| Test Program Development | Tool Gap | ASSET, SCANease, Alternative to ASSET Teradyne Lasar | Summit TDS |
| *TA - Test Architecture **SSF - Single Stuck-at Faults |
The methodology begins with a tangible management commitment. This tangible commitment provides the budget and resources to proceed with the methodology.
The second step, System Definition, involves test requirements specification. The test requirements come from an integration of customer and derived requirements for the three phases of testing-design, manufacturing, and field support. Specification involves a preliminary, life-cycle cost of test analysis, a test technology assessment, and a design impact analysis to determine the reasonableness, consistency, and validity of the requirements. Subsequently, during the same step, the three sets of requirements are consolidated into a consolidated requirements specification. These activities are supported by dependency modeling using tools such as STAT and WSTA.
The Architecture Definition phase consists of three steps: functional design, architecture selection, and architecture verification. In the functional design step, the consolidated test requirements are used to develop the top level test strategy for the design, manufacturing, and field test phases.
In the architecture selection step, the top level test strategy is used to develop and evaluate various candidate, top level test architectures. The impact of each test architecture on the candidate functional architectures is assessed and incorporated into the tradeoff and selection process for them. The test requirements, test strategy, and test architecture are then allocated to BIST/DFT hardware and software for one or more of the selected architectures. The Test Strategy Diagram (TSD) is used as the primary analysis/tradeoff tool. In addition, candidate DFT and BIST techniques are identified for later implementation, based on the specified requirements. Also in this step, any top level BIST supervisory software development will begin, as will on-line BIST code, since it may have an impact on performance and throughput. Prediction and verification processes begin in this stage as appropriate for compliance tracking.
In this area, TSTB WAVEs will be used to evaluate the capabilities of candidate test equipment in measurement of required system parameters.
In the Architecture Verification step, the next level of detail of the selected test architecture(s) are generated and additional details are provided regarding the test architecture impact on the selected functional architecture(s). For example, behavioral and performance simulations will include effects of DFT/BIST techniques, such as the estimated performance degradation due to hardware concurrent fault detection circuits or due to periodic execution of on-line BIST software diagnostics. Prediction and verification processes continue during this stage for compliance tracking.
In the Detailed Design phase, test strategies, architecture, and requirements are flowed down to the detailed design of BIST/DFT hardware and software. The detailed design of the BIST/DFT hardware is performed concurrently with functional design using automatic or manual insertion and then is reflected into behavioral and structural simulation models, whenever possible. BIST insertion tools from the tool suite from Logic Vision are used to implement board level BIST. Any remaining BIST software (e.g., for power-up or other off-line BIST functions) is implemented. Test vector sets are developed and verified for each packaging level for physical prototype test, production test, and field test. All test vector sets are documented using WAVEs. Prediction, verification, and measurement processes are used in this stage for requirements compliance tracking. These properties are processed and reported by the TSD hierarchy for the project.
In the Manufacturing phase, functional and performance testing of the overall prototype is performed, with DFT and BIST hardware and software included. Tools such as ASSET implement boundary scan testing for boards which rely on JTAG test bus-based testing. VICTORY and VTM:TOP tools support this activity. Production test is performed. Verification and measurement processes are used in this stage for compliance tracking. BIST and tester-based test cost and performance data are captured and encapsulated for the reuse library. In the field phase, BIST and DFT capabilities are in use. BIST and DFT functions are Also used for lower level (e.g., organizational and depot level) testing. Verification and measurement processes are used in this stage for compliance tracking. BIST and tester-based test cost and performance data are captured and encapsulated for the reuse library.
Throughout the entire DFT methodology, interfacing is done to the RASSP reuse library to access existing candidates and to add to the library when appropriate. In addition, feedback is being provided continuously from the compliance tracking process back to the responsible persons to assure corrective action is taken. Finally, it is recognized that iterations may be necessary because of the inherent nature of the RASSP methodology.
Teradyne's VICTORY software fully automates test generation for boundary-scan devices in boards or modules using full or partial scan technology. For individual boundary-scan parts, VICTORY automatically generates in-circuit test patterns. For boards or modules with full networks of boundary-scan parts, VICTORY generates interconnect test patterns that provide 100% pin-level fault coverage. VICTORY also supplies tools for testing the internal logic of boundary-scan devices and for testing conventional devices or device clusters, using the scan cells connected to their inputs and outputs as virtual channels.
VICTORY generates four kinds of scan tests: boundary in-circuit tests, virtual interconnect tests, virtual component/cluster tests, and boundary functional tests. VICTORY diagnostic software helps resolve boundary-scan faults during test. VICTORY also provides Access Analyzer software to help engineers optimize boards for testability, cost, and performance before layout begins.
The boundary in-circuit tests provide automatic generation of boundary in-circuit test (BICT) patterns using information from a BSDL (Boundary Scan Description Language) model, correct analysis of device constraints like pins tied to power or ground, pins tied together, or pins without physical access, automatic detection of stuck-at pins and interconnect opens without manual probing, and automatic disabling of the boundary-scan chain during in-circuit testing.
Virtual Interconnect tests (VIT) provide automatic generation of test patterns for 100% pin-level fault coverage, automatic detection and diagnosis of stuck-at pin faults and shorts and opens between boundary-scan parts without manual probing, automatic detection of shorts between boundary-scan nets and conventional logic nets that have bed-of-nails access, and automatic conversion of parallel patterns into serial, tester-compatible format with comments for simplified debugging.
Virtual component/cluster tests (VCCT) provide virtual bed-of-nails controllability and observability for testing non-scan circuitry without physical access, automatic serialization of parallel test patterns for testing individual non-scan devices or clusters of non-scan devices via the boundary-scan path, automatic organization of bit-level data for synchronous application via a combination of real and virtual channels, and simplified circuit initialization by direct forcing of inputs to desired states.
Boundary functional tests (BFT) provide thorough testing of the test access port (TAP) and 1149.1 registers, automatic testing of core device logic through the TAP using the new Serial Vector Format (SVF) interchange standard, compatibility with test techniques such as INTEST, BIST, and internal scan, made available by the device designer, and dynamic testing of device performance by applying built-in-self-test (BIST) instructions via the scan chain where the system clock is used.
LASAR by Teradyne is used to perform min-max simulation to uncover timing problems with test vectors and to develop test programs and diagnostics for board and MCM tests on ATE such as the Teradyne L300 series. LASAR is the only tool within the Design Environment which supports min-max simulation to perform accurate simulation of circuit logic, signal timing including race conditions and performance faults. Due to this accurate simulation, LASAR can be used to predict how the Unit Under Test (UUT, i.e., board/MCM) behaves during test. Time spent developing and debugging test programs on expensive testers is reduced significantly or eliminated.
As a generic element of the IDSS (Integrated Diagnostic Support System) the WSTA provides a comprehensive engineering design and maintenance support tool for improving the effectiveness and testability of new and existing systems, both electronic and non-electronic. The WSTA can be used to interact with a system throughout each phase of design, development, and deployment to ensure an optimal design for testability. Figure 5.2-1 depicts the WSTA within the IDSS process.
The WSTA makes use of a Standard System Model (SSM) representation of the system under consideration. A valid SSM will accurately reflect the failure mode dependencies/dependency model (DM) of the system components. The WSTA user must perform the proper system analysis to derive a DM which is reflective of the defined failure modes for the particular system under consideration. Once the user has an acceptable DM he can proceed to input the model into WSTA. This can be done manually via keyboard entry.
In order to save manual entry time, the user may choose to import circuit descriptive data via Computer-Aided Engineering (CAE)/Computer-Aided Design (CAD) and Logistics Support Analysis (LSA) files. The model generated will contain structural, relational and statistical information about the system design., The CAE/CAD approach will allow WSTA to generate a working SSM to which the dependency model data can be applied using the WSTA Model Editor. The structural portion of the CAE/CAD model may be derived automatically from the Very High Speed Integrated Circuit (VHSIC) Hardware Description Language (VHDL) representation of the system. Statistical/parametric information (i.e., test costs, component replacement costs, Mean Time Between Failure (MTBF), etc.) in the form of a LSA data file is merged with the CAE data into a WSTA Input Data Base (WIDB). Figure 5.2-2 illustrates the WSTA functions and process flow with the CAE/CAD derived data base (WIDB) shown as an optional starting block.
Figure 5.2-1. WSTA role in IDSS.
Figure 5.2-2. WSTA functional flow diagram.
Dependency modeling as used by the WSTA, by its very nature, is a general technique for representing any type or level of the system design including electrical, mechanical, hydraulic, or any combination thereof.
Using the SSM as the foundation, the WSTA performs four classes or types of analyses: 1) static analysis, 2) test strategy generation, 3) dynamic analysis, and 4) DFT advisement.
Using information about the system design contained within the dependency model, the WSTA Static Analyzer generates Testability Figure of Merits (TFOMs), which are measures of the inherent fault isolation characteristics of the design. The static TFOMs include information as follows:
Ambiguity Group Distribution Data - This information is a tabulation of ambiguity group composition, sizes, and aggregate failure probability.
Inherent Fault Isolation Levels - This is the traditional "scoring" factor commonly expressed as isolation to "X" number of components "Y" percent of the time.
Component Involvement Ratios - This data is a measure of the relative frequency with which each component appears in any ambiguity group.
Feedback Loop Data - This is a tabulation of feedback loop compositions, sizes, and aggregate failure probability.
Alternate Control/Observation Point Data - This information is a tabulation of alternate places in terms of input and output tests (upstream/downstream) where a given test result may be controlled or observed.
To determine the testability of the Item Under Test (IUT) based upon real world conditions, the WSTA Test Strategy Generator creates a diagnostic fault tree (i.e., a test strategy). The test strategy is an optimal (in terms of minimization of the expected value, averaged over all possible failures, of a linear combination of test time, test cost, risk, a user definable test related parameter, and number of tests) or near-optimal sequence of diagnostic tests for isolating each and every failure mode (aspect) of each and every component in the SSM. The test strategy is based on the assumption that a single aspect of a component described by the SSM is faulty. The test strategy fault tree represents a "dynamic model" of an on-line fault isolation scenario. The test strategy fault trees are ultimately stored within the Diagnostic Data Base (DDB) and may be later used by the IDSS Adaptive Diagnostic Subsystem (ADS), or similar diagnostic aid to assist in the fault isolation process.
The test strategy takes the form of a pass-fail decision tree. That is, at each node in the tree a list of suspect failure modes (or aspects) exists, and a test is identified to be performed that will best split the suspect failure modes depending on the test pass or failure criteria. Two new failure mode lists are generated; one list of suspect failure modes for the pass leg and one list of suspect failure modes for the fail leg. Processing continues to build the test strategy by determining the "next best test" recommendation for the failure modes listed until the lowest levels of the tree are reached. The lowest levels are the leaf nodes representing identification of the failure mode (single fault component) or the lowest level ambiguity group. The technique of selecting the "next best test" defines how the test strategy is optimized. An artificial intelligence heuristic state space search technique is employed that generates an optimal or near-optimal fault isolation test strategy. The heuristic employed is the "INFO-GAIN" heuristic.
The WSTA Dynamic Analyzer uses the "Dynamic Model" (test strategy) to compute and predict additional TFOMs indicative of the model of the system, and thus, if the model is accurate, the system design. These indicators represent the testability performance that may be expected during an actual, on-line fault diagnosis session and include the following:
Isolation Penalties - Mean Time to Repair (MTTR) based on individual isolation times calculated automatically from the logistics data stored in the Common Diagnostic Data Base (CDDB), coupled with individual component replacement times, and similarly, Mean Cost to Repair (MCTR).
Replacement/Isolation Tradeoff Data - Provides the user with visibility into the overall testing picture for the IUT. For example, sometimes it may be cheaper to stop testing with a somewhat larger than ideal ambiguity group than to incur the increased expense of additional testing. This data is computed for each node in the Test Strategy Fault Tree and will help the user make that determination.
Test Point Utilization Data - Provides a measure of how often each ambiguity group appears in a given test strategy. This information is also useful for making recommendations to improve the overall testability of the IUT when selecting test points and incorporating Built-In-Test (BIT).
Test Point Criticality - Provides a measure of the criticality of a test point by providing the aggregate criticality of the components associated with a given test point in the context of the test strategy. That is, the test point criticality is the number of critical components the given test point may be used to isolate and is a relative figure of merit as to the importance of the point. Test points with low criticalities that are removed have less impact on mission success since their removal results in a lower rate of growth of ambiguity group size than removal of high criticality test points would yield.
Once the testability of the IUT has been assessed, the user is presented with at least two options to follow. The first, and ideal case, is that the IUT meets each and every one of the testability requirements that have been imposed on it. In this ideal case no further analysis is required, and the job of the user is complete. In the more common case, however, the user is presented with a different situation. The IUT has failed to meet its testability requirements, and the user is responsible for making changes or recommendations for improving the IUT's testability performance. The DFT Advisor analyzes the static and dynamic testability indicators and provides the user with a set of recommendations for improving the testability of the IUT. The recommendations provided are the following:
Loop-Breaking Recommendations - The optimal point to break each feedback loop, including an ordered list of alternatives, is provided for each feedback loop in the model.
Test/Test Point Built-In Test (BIT) Recommendations - Based upon the test strategy, the WSTA will recommend a set of BIT tests/test points required to certify an IUT as being operational.
Test/Test Point Deletion Recommendations - Based upon tests in the test strategy, (i.e., tests that provide no additional information) coupled with structural information from the model, the WSTA will provide a list of tests/test points which are redundant (i.e., tests that provide no additional information in the fault isolation process) in the current design.
Test/Test Point Addition Recommendations - Using information provided by the user concerning which nodes in the IUT should be considered as test points and which ones have not been selected, the WSTA provides a list of those nodes that, if made into test points allowing for corresponding new tests, will provide the overall testability of the IUT.
To support the above functions, the WSTA contains utility functions to provide access to the data stored in the DDB, interface services for ease of selecting available functions from menus, a comprehensive model editor for the modification or creation of system and model data, and report generation facilities to enable the user to obtain displays for hard copies of the data and recommendations.
STAT is a Functional Dependency Modeling computer software which allows the automatic development of consistent and correct diagnostic information from either a top-down or bottom-up systems approach describing "How the design Works". STAT may be used to maximize the diagnostic benefit with existing designs, or with contemporaneously with the concept and proposal phases of new designs for concurrent engineering implementation. When applied to hardware data bases it:
There are many kinds of equipment, and many types of malfunctions. And, in hybrid designs there are even more combinations of events which may cause a malfunction. The sense of coverage which STAT reports on is absolute in that it assumes that ANYTHING can be the cause of a malfunction and goes about deriving the smallest non-ambiguous grouping of parts to which the test technician can isolate. STAT concentrates on the operational aspects of a piece of hardware and whether ALL operational aspects have been covered (how else will anyone know that he has a malfunction but that one of the operational characteristics was not present).
Some of the quantitative measures that STAT reports on are:
Mean Time to Isolate Malfunctions - Using available incremental test times, the STAT Software will generate this measure in accordance with paragraph 1.3.2 of MIL-STD-472 (Maintainability Prediction).
BIT/BITE Recommendations - On the basis of the proven diagnostic strategy contained within STAT these recommendations will represent the most required test nodes for fault isolation.
Feedback Loop Disclosure - Control of Feedback Loops can play an important part in the minimization of Ambiguity Group sizes. Therefore, it is important that specific information about these loops be disclosed.
Recommended Soft and Hard Break Points - A unique algorithm in STAT provides the most logical break point(s) along with comparative ambiguity group results if other break points are chosen.
Controllability and Observability Points - These points are made on the basis of all interdependent functional and hardware knowledge possessed by STAT.
Fault Detection Determination - Here STAT suggests what the Output Testing Order should be to provide 100% detection of Malfunctions with as few tests as possible. STAT also allows the User to determine his own Output Ordering Sequence to obtain the percentage of Detection that can be achieved, within a specific number of tests. This is not a calculation, but rather REAL information that can be enforced in the maintenance shop TODAY.
Diagnostic Flow Table and Diagram - This information is displayed in a WYSIWYG Viewing window with special "Hot Scrolling" Features. In instances where schematic detail is input to the STAT Software, this information is directly usable at the user's facility to isolate actual malfunctions in any maintenance document like a T.O., TRD, or TPS.
STAT is a mature method of creating, structuring, and organizing a complete database (model) of any design to formulate and expose proven objective, consistent, and accurate testability and diagnostic information. STAT is directly related to the Dependency Modeling required by MIL-M-24100 (as a referenced specification to MIL-STD-1388). Its Functional Dependency Model database can be used to produce either inherent or dynamic diagnostic data for the instantaneous creation and implementation of a powerful, customized "Diagnostic Strategy Engine". It can objectively and consistently produce Testability Reports (which categorize both Test and Testability parameters), Diagnostics directly applicable to Portable Maintenance Aids, Production Testing, and Automatic Test Program Sets (Development/Modification). It can also be used to influence and enhance LSA and FMEA information.
The STAT database is uniquely capable of exposing any logical errors through the use of ancillary functional block diagram creation and test prompting tools (DIAGRAF and DIAVIEW). It can be automatically and concurrently created with the design (via CAD import capabilities) and provide an accurate and objective feedback and assessment of the design to all Concurrent Engineering (or Integrated Product Development) disciplines (including Design, Support, Production, Value Engineering, Contracts, etc.). Thus, by definition, DYNAMIC INTEGRATED DIAGNOSTICS is an easily accomplished process.
STAT, uniquely and instantaneously determines i-th order dependency relationships of all design elements and therefore, can determine simultaneous multiple malfunctions and can provide an indefinite number of diagnostic scenarios based on many differing maintenance concepts. Since STAT is System oriented, it allows the collection of Libraries of information to be easily linked. Because of the System aspects of STAT, it is able to easily be manipulated as desired by the Customer. Therefore, STAT is able to retain the integrity of the design at a macro-perspective of the system, while retaining the refinement of the design to its smallest component part or signal related thereto. Likewise, detectability and fault isolation can be performed at an level, while having the flexibility to adjust in accordance with any restrictions or conditions that may be assessed on the diagnostic process.
The direct outputs of STAT can be used to satisfy the requirements of MIL-STD-2165 (Testability), MIL-STD-1345 (Test Requirements Documents), and MIL-STD-1814 (Integrated Diagnostics).
ASICTEST is a family of test automation products that reduce time-to-market while implementing a high quality and low cost test strategy. It couples front-end generation of synthesizable RTL code for memory BIST and 1149.1 TAP/boundary scan, with back-end tools for scan insertion and combinational ATPG. ASICTEST features three products: ICRAMBIST, JTAGSYN, ICSCANTEST. Together, they provide a complete test strategy for complex, structured custom ASICs.
Figure 5.2-3 shows the interrelationships among these tools in the context of design stage. Front-end phase corresponds to logic generation. Back-end refers to test of logic which has been generated during the front end processing.
Figure 5.2-3. ASICTEST tool suite.
ICRAMBIST is a front-end test automation tool that is run early in the design flow to generate a complete design implementing BIST of embedded static RAMs. The tool generates synthesizable RTL code (plus constrains) for a BIST controller and any memory interfaces needed to implement an efficient, deterministic BIST scheme for the memories. To validate the design, a stimulus file is generated for use with simulation.
ICRAMBIST implements a patented memory BIST strategy that offers at-speed, deterministic testing of the memory, with low area overhead and low routing complexity. The BIST controller generated by ICRAMBIST contains a finite state machine that implements standard memory testing algorithms. Unlike a random pattern scheme, the ICRAMBIST scheme gives know fault coverage. A BIST collar is generated for each embedded memory permitting the BIST controller to apply the test patterns through a serial data path. The collar loads and unloads the memory data in parallel and at-speed. The scheme also allows multiple memories, of variable size, to share the same controller.
The use of a serial data path and the ability to share a controller among multiple memories makes the overhead extremely low. The area of a BIST controller or a collar is only about 400 gates each for a MARCH test and varies little with memory size. The collar introduces a single mux delay on the memory signals, but in many technologies this mux is now included in the memory.
The overhead introduced by using the BIST scheme is more than offset by the savings in test pattern development effort. Using BIST eliminates the need to develop any memory test patterns. The test pattern simply turns on the controller and monitors the BIST status bit.
JTAGSYN is a front-end test automation solution that is run early in the design flow to generate a complete set of design files to implement 1149.1 Test Access Port and Boundary Scan. The tool generates synthesizable RTL code for the Test Access Port (TAP) and Boundary Scan cells. It also provides a complete top-level module instantiating and connecting the TAP and BSCAN cells together with the I/O pins and the core modules. To validate the design, a stimulus file is generated for use with simulation. In addition, JTAGSYN produces a Boundary Scan Design Language (BSDL) file that can be used to describe the ASIC to board-level test tools. A vendor pinout file for the ASIC is also generated.
JTAGSYN works from a technology independent, pin description file. Describe the pins needed for the ASIC, and the desired options, and JTAGSYN is ready to run. Changes to the top-level module can be made quickly, simply by altering the I/O description and regenerating.
The TAP and Boundary Scan cells generated by JTAGSYN are based on a customizable library allowing different 1149.1 implementations. The product comes with a library featuring a flexible TAP, with optional device ID register, and a complete set of Boundary S cells. The TAP offers an extended instruction/status register for supporting internal scan, BIST and other user test modes. The Boundary Scan cells in the library include input, output, bi-directional, enable and sample-only capabilities.
JTAGSYN does not require the designer to be an expert in the 1149.1 specification or create and edit a BSDL file. The input is a text file in which the designer only specifies design information, such as the pin list, special core nets (clocks, reset, scan, and status), and any options. JTAGSYN accepts these inputs and performs processing necessary for boundary scan logic generation.
ICSCANTEST is a full suite of tools (ICSCAN™, ICCHECK™, ICATPG ™, and ICREORDER™) for scan chain insertion, scan rule checking, combinational ATPG and fault simulation, and test pattern ordering/formatting/verification for gate level netlists. Flexibility is in the form of user options and support for scan models. The scan models permit the tools to transparently handle memories and test mode logic (like the 1149.1 Test Access Port), as well as some nonscannable circuitry.
ICSCAN offers flexible scan chain insertion to enhance the testability of the gate level netlist. The tool automatically replaces regular flip-flops wit scannable equivalents and ten routes the scan chains between them. The designer can specify which flip-flops or modules should be scan inserted, the number of scan chains and the preferred routing order. Existing scan chains can be specified and connected. The modified gate level netlist can be fed back to logic synthesis for re-optimization.
ICCHECK verifies that the circuit meets standard scan design rules and extracts the combinational portion of the circuit while taking into account the scan models. The rules are applied in test mode only, thus clocking strategies in normal system mode can be more flexible.
ICATPG automatically generates test patterns for the combinational portion using both deterministic and pseudo-random approaches. It has very high performance and is capable of handling circuits with hundreds of thousands of gates using both stuck-at faults and transition faults. It also supports incremental fault simulation and pattern generation for target fault lists.
ICREORDER sequences the test patterns for application to the scan chains from the external pins. It understands 1149.1 and generates the test set taking it into account. The final test set may be targeted to a number of different simulation, tester and vendor formats.
The Test Strategy Diagram is a graphical construct which describes how flaws and faults associated with the life cycle phases of a project are handled by a set of assigned means. The fault coverage effectiveness of each means in terms of detection, isolation, and correction and the order in which the means are applied are specified. Figure 5.2-4 shows the elements of a TSD. The processes of detection, isolation, and correction b each of the assigned test means are described in three rows of elements containing transfer functions and attributes. The transfer function represents the effectiveness of a test means at either detection, isolation, or correction. Each successful detection, for example, is passed on to the same test means for isolation. If possible, isolation is accomplished and is passed to that test means for correction. An unsuccessful attempt at detection, isolation or correction is immediately passed on to the next test means for possible resolution. Successful operations are indicated by the paths labeled Os, which represents the number of events successfully processed by the test means at that particular stage. Unsuccessful operations are indicated by Ou, which is the number of missed detections, isolations, or corrections. Effectiveness of a test means at any operation is quantifiable as the ratio of the Os value to the number of incoming faults. This ratio is called the transfer function for a specific test means for a specific operation. These are indicated as TFDi in Figure 5.2-4. Other entries a TSD are the test attributes labeled ATTR in the boxes. These typically are cost and time for each particular test for each operation. Other significant quantities can be added to reflect a specific test environment.
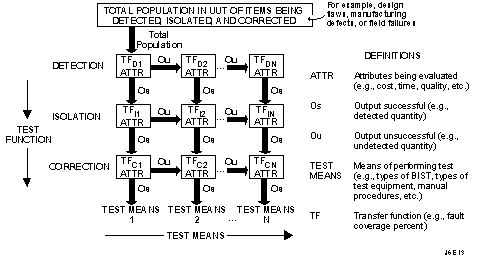
Figure 5.2-4. Test strategy diagram concept.
The TSD is constructed from the test means information specified in the Consolidated Requirements document. It summarizes the results of the process of converting project requirements to test means sequences with assigned flaw/fault coverage performance. More specifically, it displays the singular test philosophy and any supplemental test means added to a particular project phase. It becomes the vehicle for quantitative measurement of conformance to requirements based upon application of the selected test means. The TSD explicitly shows the effects of application of each of the test means selected for each phase of the project life cycle. A TSD for a project phase such as manufacturing is made by creating a three row by N column matrix containing detection, isolation, and correction entries in the rows and N test means in the N columns. The test means are ordered as specified in the final version of the consolidated requirements template sheets for the manufacturing phase.
There is one TSD for each of the identified flaws/faults associated with the design, manufacturing, and field support phases of a project.
The complete collection of TSDs consists of a hierarchy of matrices which spans project phase and packaging levels as shown in Figure 5.2-5.
Four classes of TSDs exist:
The classes are represented by the labels R, P, V, and M in Figure 5.2-5.
Figure 5.2-5. Hierarchy of test strategy diagrams.
All TSDs related to a particular flaw or fault have the same form regardless of class. The purpose of multiple classes is to allow for comparison among the classes. This enables constant comparison of test means performance at any phase and packaging level of a project with requirements assigned to that test means. A secondary purpose of multiple TSD classes is validation of assumptions made at system design and verification times.
The TSD sets for BM3 were constructed as EXCEL workbooks. A workbook is essentially a three dimensional "spreadsheet", a collection of related two dimensional spreadsheets designed to efficiently implement data sharing among all the two dimensional spreadsheets in the set. These worksheets will be referred to as Sheets in the following discussion.
Each workbook consists of a set of worksheets which details the four classes of TSDs for one particular flaw or fault. Three worksheets form a set capable of controlling/monitoring handling of a specific flaw/fault. A separate workbook is assigned to each flaw and fault for which requirements have been established. Individual worksheets are assigned to requirements, predictions, verification, and measurement related to the flaw/fault. For any one complete workbook, the number of worksheets will be up to 12. At system design levels, fewer Sheets will be needed since verifications and/or measurements may not apply. Twelve sheets will be required at the field support project phase and at the manufacturing phase for handling acceptance/qualification testing.
During the system concept and design development phases of a project, the requirements and prediction worksheets are populated. The verification and measurement worksheets will be populated as the project proceeds into the actual design and fabrication phases.
Figure 5.2-6 shows a typical EXCEL TSD describing requirement allocations to selected test means for bridging, open, and stuck-at faults which characteristically occur during a project manufacturing phase.
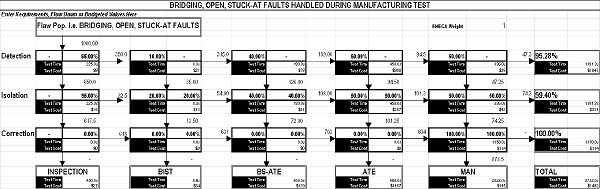
Figure 5.2-6. Typical requirements TSD.
This TSD describes details of the allocations to the detection, isolation, and correction levels which are required to be achieved by each of the test means assigned to the testing for the flaw/fault. On this sheet, the user will enter the transfer functions, cost, and time allocations appropriate to the flaw/fault being processed.
The ASSET Diagnostic System supports interactive debug and test of IEEE 1149.1-component designs. This bus supports controllability and observability of components and interconnections on a printed circuit board (PCB) via a 4 wire connection to the PCB. Components are serially linked in a scan chain. Serial test vectors can be applied to components to drive them as required. Also, the state of the output pins on components can be obtained via serial read process. The Diagnostic System allows a user to interactively control and observe scannable signals at the register, bus, or pin level. The Diagnostic System also provides the capability to locate faults found on a device, board, or system. These faults can be detected through interactive access and control and scan vector analysis.
The ASSET Diagnostic System uses standard JTAG instructions such as EXTEST to debug designs interactively. The Diagnostic System has features similar to logic analyzers to aid the hardware engineer doing prototype design verification in an R&D lab.
The ASSET Diagnostic System includes all capabilities found in the ASSET Test Vector Development System. These include:
In addition, the Diagnostic System includes the ASSET Scan Analyzer™ and Debugger for interactive access, control, and observation of a UUT.
Scan analyzer is used to view vectors and analyze response of hardware by comparing expected and actual values.
The ASSET Debugger provides controllability and observability of the IEEE 1149.1 architecture wit the following features:
The ASSET system installs on a PC and interfaces to a board under test via a standard JTAG test bus link.
VTM:TOP is a VICTORY™ software developed by both Mentor and Teradyne. It enables design and test engineers to take maximum advantage of the observability and controllability provided by boundary-scan devices on electronic assemblies that have a mix of boundary-scan and conventional technologies.
VTM:TOP provides the engineer with a link between design and test. It provides optimized test-pad selection for PCBs and MCMs that contain boundary-scan (IEEE 1149.1) devices. VTM:TOP is used after design entry and before CAD layout, to generate reports that help selection of the optimum number of test pads for both in-circuit and functional cluster testing.
When VTM:TOP is used along with Mentor's Physical Test Manager, testpoint analysis and placement is fully automated. To allow performance of testpoint analysis as part of the design trade-offs, VTM:TOP is integrated with DSS, Design Viewpoint Editor, and Board Station.
Testpoint analysis includes:
VTM:TOP can specify the networks that do not require access when using the VIT technique. Conversely, it can recommend networks that should have access to minimize complexity when using the VCCT technique.
TSTB is one of the prototype WAVEs tools developed by Rome Laboratory. The WAVEs objectives are to capture logic signal histories during simulation or UUT test patterns during hardware test and easily exchange data between them. When TSTB is run on a VHDL design, the WAVEs model specific packages generated are the UUT_pins package, the waveform generator procedure template, and the header file template and the test bench. The waveform generator file is then modified to describe the input/output waveforms and the clock period. The test bench generated by the tool wires the WAVEs waveform data set and the VHDL model together for design verification. A user developed vector file to stimulate the testbench is needed to stimulate the program. This vector file is very similar to the one which will ultimately be used for hardware test.
The TDS software system is designed to provide all the tools needed to manage the behavioral data associated with an electronic product development cycle. With TDS, data is generated, reformatted, stored, analyzed, modified, and transformed into test programs to support all phases of design and production.
Data can be used from many sources. Data from most simulators can be processed and existing test programs can be used as a data source. Data can be viewed with the TDS tools and then quickly analyzed for completeness and adherence to specifications. In addition, the capability to check data compatibility with the intended tester.
Modifications of the waveforms including adding or adjusting timing information, aligning signal edges, eliminating unnecessary pulses, and eliminating hazardous test conditions can be accomplished. Output can be generated for resimulation or for production of high quality test programs for the tester of choice.
The TDS software system consists of many modules. The components of the TDS software system are:
FASTSCAN replaces flip-flops in the design with scan flip-flops and generates test vectors.
QuickGrade is used for fault grading.
PTM:SITE inserts test points on MCM Station using results from VICTORY.
SCANease is an alternative to ASSET Diagnostic System tools.
Test Compiler combines test synthesis, ATPG, fault simulation, and test management to automate DFT. Test Compiler products are used throughout the design process to analyze and improve the testability of designs. Test Compiler family products can be used to synthesize and insert test structures into the design and generate high fault coverage test patterns for scan-based designs.
STARS produces a design model-base directly from Computer-Aided Design (CAD) output data files. The STARS architecture includes automatic translation of CAD output in either EDIF or VHDL format. Most popular CAD systems today output EDIF format. In the future, VHDL design representation will become the standard for DoD design efforts. In cases where no CAD data exists, the STARS has been supplemented with a commercially available, off-the-shelf, low-cost schematic design tool, OrCAD, which can be used to graphically enter schematic data and then output into the appropriate EDIF format.
As the design of a system evolves, it is necessary to generate a series of diagnostic design candidates in order to support the trade-off and optimization process. Without the ability to have multiple candidates, the systems engineering team does not have the detailed insight required to make informed decisions. A diagnostic design candidate is a profile of the diagnostic capability and accuracy given a specific combination of tests: performance monitoring, built-in tests, operator observations, external tests and measurements, and probe points.
STARS has automatic utilities for incorporating design updates into the model-base. The utilities serve to "merge" the updated design into the old design, including all associated diagnostic design candidates. The only manual part of the process is in defining the attributes of the updates. STARS assists the user in this task by pinpointing where the design has changed. The use of X-Windows under DESQview/X enables the testability interaction to occur directly on the designers CAD platform (PC or workstation).
STARS employs a dynamic reasoning capability called a Diagnostician. A Diagnostician is the combination of the model-base, in matrix format, and a software routine which interacts wit the UT design representation (model-base) with a finite set of test and measurement data to diagnose faults through interpretation of test results. The UUT design representation, generated automatically by the Diagnostic Analysis and Repair Tool Set, is in a Fault/Symptom Matrix format. The Fault/Symptom Matrix is a mapping of all possible failure locations to the information, or test data, that imply each specific fault. The software routine makes use of set covering algorithms and cones of evidence to relate the test information to the mapping provided by the matrix.
The Diagnostician is useful for a multitude of mission essential functions including: fault management, reconfiguration, and virtual prototyping.
The Diagnostician can be embedded within prime system hardware to provide self-sustained diagnostic capability and/or can be embedded within a piece of automatic test equipment to act as the diagnostic test program set.
In the Test Program Set application, the need to develop extensive, lengthy diagnostic test programs is minimized. The reduction in the number of diagnostic test programs is accomplished by utilizing the Diagnostician tied to the functional, or end-to-end programs, which are normally developed for factory testing or acceptance testing. The functional test program includes a series of tests and measurements which determine if the unit is operating within specified performance levels. By logging the results of these individual tests and measurements, the Diagnostician can interpret the results into diagnostic information. In many cases, no additional tests will be required to achieve fault isolation. In cases where, based upon the results of the functional test, an ambiguity group exists, the Diagnostician will make calls to the test program set to execute those tests, and only those tests, which will provide diagnostic resolution.
In the embedded application, the Diagnostician can be hosted on any embedded computer or microprocessor. It can interact with any performance monitoring and sensor data, including data directly off a 1553 or 1149.1 bus.
The Economic Modeling Tools are EXCEL spreadsheets that allow the user to enter details of a board or ASIC design and observe the effects on the cost of production quantities of the product. The board design analyzer includes a comparison of two alternative approaches to test implementation, ATE and BScan, and allows the user to determine the cost effectiveness of BScan DFT insertion. Test strategies for each case are defined by the user. The tools are very interactive and perform a "real time" "what if" capability which gives instant reaction to user selected changes to design factors. The tools present many parametric cost charts as part of the spreadsheet output.
IKOS Voyager FS provides concurrent fault processing in software comparable in performance to special purpose hardware fault accelerators. It uses the same sign-off and certified IKOS ASIC libraries as used by Voyager CSX and Gemini CSX. It provides mixed-level fault simulation with VHDL test bench methodology, in addition to traditional vector-based fault simulation. The WGL, EDIF and VERILOG(TM) formats are supported for import for classical design flows. There is full timing fault simulation for multi-phase clocks, multiple strobe points, and feedback loops
The Fault Simulation Accelerator from ZYCAD may be used.
RASSP CDRL A007 - 6/98 5-2 cad system description Baseline 2.0
![]()
![]()
![]()
Next: 6.0 Enterprise Sysem Toos Up: Appnotes Index Previous:4.0 Hardware Design Tools
Approved for Public Release; Distribution Unlimited Dennis Basara